Spatial Diagnosis
Start with conditions in the Greater Bay Area to understand why the analysis extends to the entire South China coast.
01THE BOOK IN DATA
Explore economic trends, global comparisons, regional cooperation and pathways for action through accessible data stories.
The numbers explain why South China Coast was proposed, how its effects may arise and what conditions its vision requires.
READING PATH
The book's three parts form a connected argument, moving from an assessment of current conditions to a framework for action.
Start with conditions in the Greater Bay Area to understand why the analysis extends to the entire South China coast.
01Identify the effects and limits of integration across regions, firms and spatial distances.
02Turn the strategy into a long-term pathway through a six-dimensional vision, six forms of connectivity and three stages of implementation.
03GROWTH TRAJECTORY
First examine changes in economic scale, then explore the area's role as a resource-allocation hub for the entire coast.
The Greater Bay Area's GDP grew by about 24.3% in 2019–2024, expanding the economic base of the coastal region's core engine.
Source: South China Coast, Figure 1-3, compiled from National Bureau of Statistics data.
GLOBAL POSITION
Comparisons of economic output on a consistent basis place the Guangdong–Hong Kong–Macao Greater Bay Area among the world's leading bay areas.
Source: South China Coast, Figure 2-2, compiled from National Bureau of Statistics, IMF and World Bank data.
2049 VISION
South China Coast defines high-quality development through six mutually reinforcing dimensions, making the vision open to discussion, observation and ongoing adjustment.
Enable capital, trade, professional services and supply chain capabilities to flow more efficiently through the coastal network.
These six dimensions represent different aspects of one development goal, rather than separate indicators.REGIONAL COMPLEMENTARITY
The six regions differ in industrial strengths, external connections and regional roles. Select a region to see its place in the shared network.
EFFECT BOUNDARY
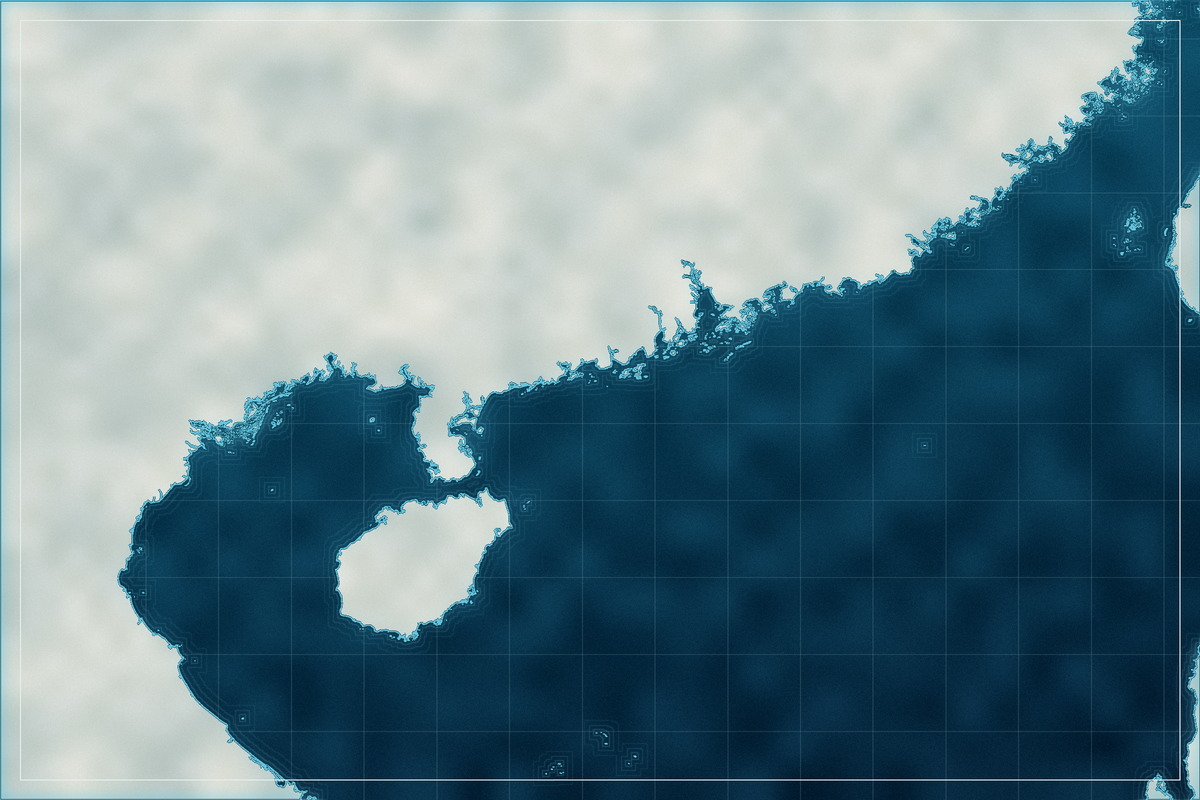
Spatial analysis does not provide a universal radius. It shows that cooperation needs real connections to transmit its effects.
 300 km250 km50 kmXiamenShantouGuangzhouShenzhenHong KongZhuhaiYangjiangZhanjiangHaikouCOREGreater Bay Area
Agglomeration effects are most direct
Positive effects may still extend
Effects weaken markedly
The book's spatial analysis suggests that distance weakens the benefits of integration. Transport, industrial and institutional connections determine whether these effects can extend beyond city boundaries.
Adapted from the spatial spillover analysis in Chapter 9 of South China Coast, using distance to illustrate the findings.
ROAD TO 2049
The vision requires staged implementation: establish connections, build an integrated system and sustain effective cooperation.
Build consensus, strengthen policy support and improve infrastructure to establish a framework for all six forms of connectivity.
Strengthen each region through coordinated industrial cooperation, connected innovation networks and institutional opening-up.
Align cooperation across the whole coast with high-quality development goals to create a coastal model with a global outlook.
The page distinguishes facts, statistical associations, scenario analysis and strategic judgments. Charts explain findings without treating correlation as proven causation or long-term visions as accomplished facts.
Adapted for a general audience from Figures 1-3, 2-2 and 11-3, Tables 2-1 and 11-1, and the spatial analysis in Chapter 9 of South China Coast.